You should spend about 20 minutes on this task.
The chart below shows the amount of leisure time enjoyed by men and women of different employment status.
Write a report for a university lecturer describing the information shownbelow.
You should write at least 150 words.
Sample Answer 1
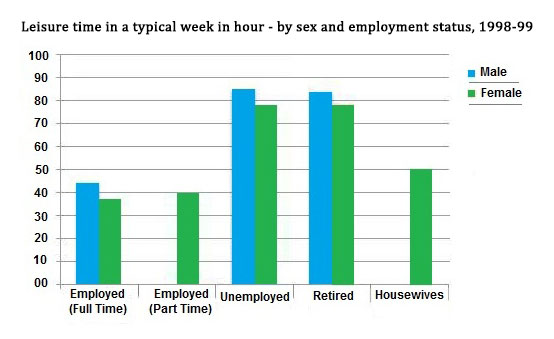
The chart shows the number of hours of leisure enjoyed by men and women in a typical week in 1998-9, according to gender and employment status.
Among those employed full-time, men on average had fifty hours of leisure, whereas women had approximately thirty-seven hours. There were no figures given for male part-time workers, but female part-timers had forty hours of leisure time, only slightly more than women in full-time employment, perhaps reflecting their work in the home.
In the unemployed and retired categories, leisure time showed an increase for both sexes, as might have been expected. Here too, men enjoyed more leisure time – over eighty hours, compared with seventy hours for women, perhaps once again reflecting the fact that women spend more time working in the home than men.
Lastly, housewives enjoyed approximately fifty-four hours of leisure, on average. There were no figures given for househusbands!
Overall, the chart demonstrates that in the categories for which statistics on male leisure time were available, men enjoyed at least ten hours of extra leisure time.
Sample Answer 2:
The graph compares the amount of leisure time enjoyed by people of different employment levels in a typical week in the year 1998-1999.
In the given column graph, no data has been provided for the part-time employed and house-staying men. For rest of the cases, Men have more leisure time than women of the same category. The highest amount of leisure hours is enjoyed by those, who are unemployed. Unemployed men had approximately 85 hours of spare time and women from the same category had about 83 hours. The retired people also enjoyed the same amount of leisure activities as did the unemployed men and women. On the contrary, full-time employed men had a total of 40 hours leisure time compared to about 37 hours of women from the same status. Finally, women with part-time jobs had 40 hours to spend for their leisure activities and housewives had 50 hours leisure time per week.
In conclusion, unemployed and retired people, both men and women enjoyed more leisure time than employed people and men compared to women had more time for leisure activities.
Sample Answer 3:
The given graph gives information on the number of leisure hours enjoyed by male and female with different employment status in an average week of the year 1998 and 1999. As is observed from the graph, the male had more free times than the female and employed people enjoyed less free hours than the unemployed or retired persons on an average.
The line graph compares the amount of leisure time enjoyed by people with different employment statuses and also compares the leisure hours between men and women. In a typical week of 1998 – 1999, full-time employed men had more than 40 hours of leisure time compared to the 38 hours leisure time of women. Females with part-time jobs had 40 hours of free time which is 2 hours more than the full time employed woman which is natural considering the job natures. No data for part-time employed and house staying men were given in the illustration. On the other hand, unemployed and retired males had more than 80 hours of leisure time in a week while females of these 2 categories had around 78 hours of free time in a week. The amount of leisure time enjoyed by housewives was 50 hours which is less than the unemployed and retired females but higher that employed females.
In summary, the graph depicts that the male had more leisure time to enjoy than the female possibly because of the females involvement in household works and people without jobs had almost double leisure times than the employed population.
Sample Answer 4:
The bar chart compares the leisure hours enjoyed by male and female based on the employment status during the year 1998 to 1999.
It is clearly evident from the graph that female in all respective of employment status enjoys time killing when compared to male. Men and women, who are unemployed and retired, spent more leisure hours when compared to employed people. Unemployed males (85 hours per week) and females (78 hours per week) only show a slight difference in hours spent for leisure time. Similarly, retired employees (male75 hours per week, female 82 hours per week) spent almost same leisure hour irrespective of gender.
In contrast, the number of leisure hour spent by employed males is 42 hour weekly and by female employees, this was around 40 hours per week. Housewives spent almost 10 hours more than employed females (50 hours per week).
Overall, the bar chart shows the number of leisure hours spent during retirement and unemployment is high when compared to employment period. In addition, males enjoy more leisure hours per week when compared to females.

Be First to Comment