ACADEMIC WRITING TASK 1
You should spend about 20 minutes on this task.
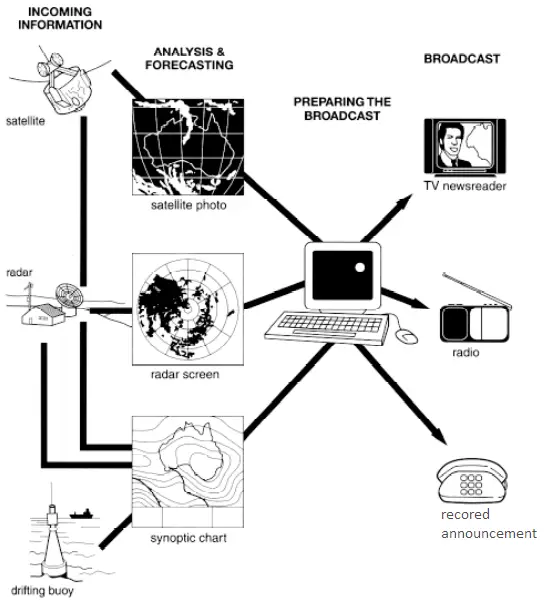
The diagram below shows how the Australian Bureau of Meteorology collects up-to-the-minute information on the weather in order to produce reliable forecasts.
Write a report for a university lecturer describing the information shown below.
You should write at least 150 words.
Model Answer 1:
The given diagram shows how the weather information is collected by Australian Bureau of Meteorology to provide accurate and updated weather forecasting. As is observed from the given illustration, the weather information collection is done via satellites, radars and drifting buoys and then analysed before broadcasting them to the public.
As is presented in the diagram, the weather information is collected using three different types of sources namely, satellites, radars and drifting buoys. The raw data collected from satellites is basically satellite photos while radar information is observed from the radar screens and the synoptic charts are yielded from the drifting buoys and these three types of data are fed into a computer system to analyse and prepare the weather news for broadcasting.
After that, the weather, the news is broadcasted in different public media like televisions, radios and telephones. The final information regarding the weather is provided to the public via TV news, radio broadcasting and as a recorded announcement in devices like telephones.
Model Answer 2:
The given figure illustrates the process used by the Australian Bureau of Meteorology to forecast the weather. There are four stages in the process, beginning with the collection of information about the weather. This information is then analysed, prepared for presentation and finally broadcast to the public.
Looking at the first and second stages of the process, there are three ways of collecting weather data and three ways of analysing it. Firstly, incoming information can be received by satellite and presented for analysis as a satellite photo. The same data can also be passed to a radar station and presented on a radar screen or synoptic chart. Finally, drifting buoys also receive data which can be shown on a synoptic chart. In the third stage of the process, the weather broadcast is prepared on computers. Finally, it is delivered to the public on television, on the radio or as a recorded telephone announcement.
Model Answer 3:
The illustration provides information about the process of collecting current and reliable weather forecasts and then broadcasting this to mass people which are conducted by the Australian Bureau of Meteorology.
As can be seen, this process needs some equipment to gather news forecasts and three main sources, such as satellite, radar, and the drifting buoy is used for collecting weather information.
To begin with, the satellite is used to capture images of Australian weather from the outside of the planet. Meanwhile, radar can give screen pictures while a drifting buoy which is placed on the sea reveals a synoptic chart of the Australian climate.
Subsequently, all of the information is analysed to know the real weather condition in Australia. After that, these data are put on the computer to prepare the report for the public broadcast. People will know the weather forecasts in Australia through various media, in particular, TV newsreader, radio, and recorded announcement.
Model Answer 4:
Ways of data gathering, its analysis and weather forecasting, as well as broadcasting methods followed by the Australian Bureau of Meteorology to produce accurate weather forecast, are illustrated in the process flowchart.
As shown in the diagram, the Australian Bureau of Meteorology collects information from different sources, like satellites hovering in space, radar sets positioned at different places on the Earth and drifting buoys anchored to the seabed in the vicinity of the continent. Before forecasting all input data need to be analyzed, using radar screens and synoptic charts.
The former is designed on the basis of source materials coming from the satellite and radar sets, whereas the latter is compiled on the basis of the information from all sources mentioned above. As soon as the information analyzed and the forecast is done, it is prepared for broadcasting. Finally, precisely prepared forecast information reaches TV studios, radio stations and places where it can be recorded for further announcement.

Be First to Comment