ACADEMIC WRITING TASK 1
You should spend about 20 minutes on this task.
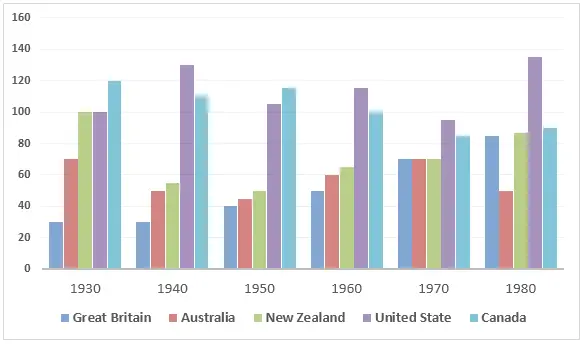
The table below shows the figures for imprisonment in five countries between 1930 and 1980.
Write a report for a university, lecturer describing the information shown below.
You should write at least 150 words.
Sample Answer:
[This model has been prepared by an examiner as an example of a very good answer. However please note that this is just one example out of many possible approaches.]
The table shows that the figures for imprisonment in the five countries mentioned indicate no overall pattern of increase or decrease. In fact, there is considerable fluctuation from country to country.
In Great Britain, the numbers in prison have increased steadily from 30 000 in 1930 to 80,000 in 1980. On the other hand in Australia, and particularly in New Zealand, the numbers fell markedly from 1930 to 1940. Since then they have increased gradually, apart from in 1980 when the numbers in prison in New Zealand fell by about 30,000 from the 1970 total. Canada is the only country in which the numbers
in prison have decreased over the period 1930 to 1980, although there have been fluctuations in this trend.
The figures for the United States indicate the greatest number of prisoners compared to the other four countries but population size needs to be taken into account in this analysis. The prison population in the United States increased rapidly from 1970 to 1980 and this must be a worrying trend.
Sample Answer 2:
The bar graph shows the number of detainees in five countries – Britain, Australia, New Zealand, US and Canada between 1930 and 1980. Overall, Canada had the highest number of prisoners in 1930 while Great Britain had the least, but after 50 years, the number of prisoners decreased in Canada and the United States had the highest prisoners.
Initially, in 1930, Canada had 120 thousand prisoners and that was the highest number of inmates among the five countries. There were 100 thousand prisoners both in the US and New Zealand. Again, Australia had around 70 thousand prisoners and Great Britain had only 30 thousand prisoners and that was the lowest. After a decade, the prisoners’ number in Britain remained almost the same while the number decreased in Australia, New Zealand and Canada. But this year the total number of prisoners increased in the US by 30 thousand and reached to 130 thousand. In 1950, the prisoners’ number increased in Britain and slightly decreased in Australia and New Zealand. On the other hand, the prisoner in Canada increased and got the highest among the five countries and decreased in the US. A similar trend in terms of prisoner numbers in these countries could be observed after a decade. Finally, in 1980, the prisoners’ number in these countries increased except in Australia. The US had the highest number of prisoners in this year and Great Britain, Canada and New Zealand had more than 80 thousand prisoners in this year.
In summary, over the 50 years period, the crime and imprisonment number got worse in US and Britain while Australia, Canada and New Zealand did some progress. In 1980, Australia had the least number of prisoners which indicate their improvement in law and order.
Sample Answer 3:
The table chart compares the numbers of prisoners from 1930 to 1980 in five different countries, namely Great Britain, Australia, New Zealand, the United States and Canada. At a glance at the graph reveals that imprisonment figure in the USA and UK climbed over the period and in Canada, Australia, New Zealand, it actually declined.
It is clearly seen that the United States had the highest number of inmates. Also, Britain had the lowest figure in 4 out of 6 years. In 1930, the number of prisoners in the United States was the highest, with 120 thousand prisoners, then this number increased significantly to reach a peak of 140 thousand in 1980. By contrast, Britain had the lowest figure of prisoners until 1970, then the figure jumped suddenly to reach 90 thousand.
Canada had the highest number of imprisonment in 1930 and 1960 with nearly 140 thousand people in each year.In 1970 the number of prisoners in Great Britain, New Zealand and Australia was same, about 70 thousand people. In 1980, 50 thousands of people in New Zealand were put in prison which was the lowest figure in this year.
Sample Answer 4:
The bar chart depicts the number of prisoners in thousands, in five different countries, namely Great Britain, Australia, New Zealand, United States and Canada during a period of 50 years commencing from 1930. Overall, the graph gives an impression that, imprisonment rate in the USA and UK escalated over the time while in Canada, Australia, New Zealand, it actually decreased.
As is evident in the presentation, Great Britain had the lowest number of imprisonment throughout the initial 40 years till 1980. Interestingly, Britain had witnessed a steady growth in figures, which started from around 30000 in the year 1930 and reached around 70000 in the year 1970. By contrast, the United States had the maximum number of criminals throughout the entire span of years except in the first decade, which is 1930. Moreover, in the year 1980, United States had to imprison the highest number of citizens in the entire period, which accounted for around 130000.
It is apparent from the graph that the crime rate in Canada had fallen gradually and steadily, from 120000 people in 1930 to a significantly less 90000 people in 1980. However, except for the years, 1930 and 1980, Australia had considerably less number of jailing and the New Zealand had always positioned as top three consistently just behind Canada and the United States.

Be First to Comment